In a Game of Chance Randomness is not so Random
This post aims at providing mathematical explanation to how randomness in stock prices can be statistically modelled.
Rajat M Ranka
9/4/20232 min read


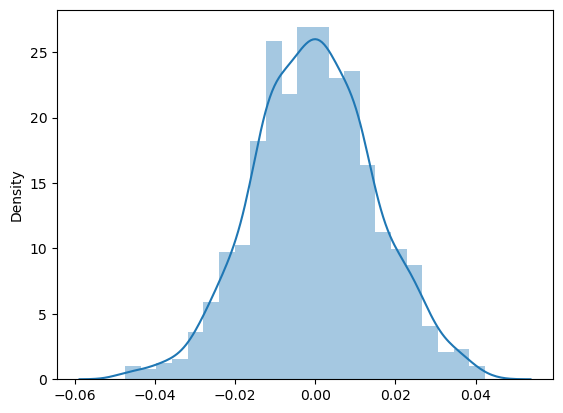
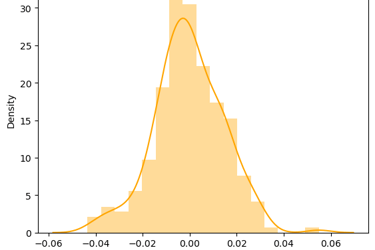
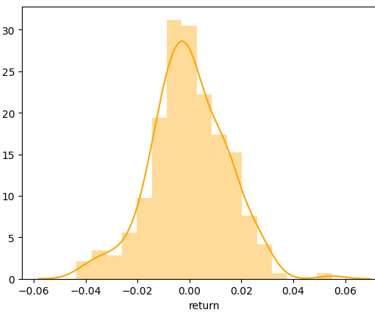
There is a popular saying that markets are unpredictable and it is the randomness in stock price that makes it unpredictable. True Prices of stock lies some where between complete predictability and perfect randomness. Several models with varying degrees of accuracy have been proposed in this regard to model prices of stock in stochastic sense. Based on historical data it is found that stock returns tends to follow a Normal Distribution. As can be seen from below images the Right image is actual distribution of S&P500 returns and Left Image is simulated distribution of random normal variables with mean and standard deviation being same as that of S&P500 returns. It is worth noting how closely the simulated distribution mimics the actual distribution. Thus returns can be expressed as Ri = (Si - Si-1) / Si-1 = mean + standard deviation * ∅ where ∅ is the random normal variate.
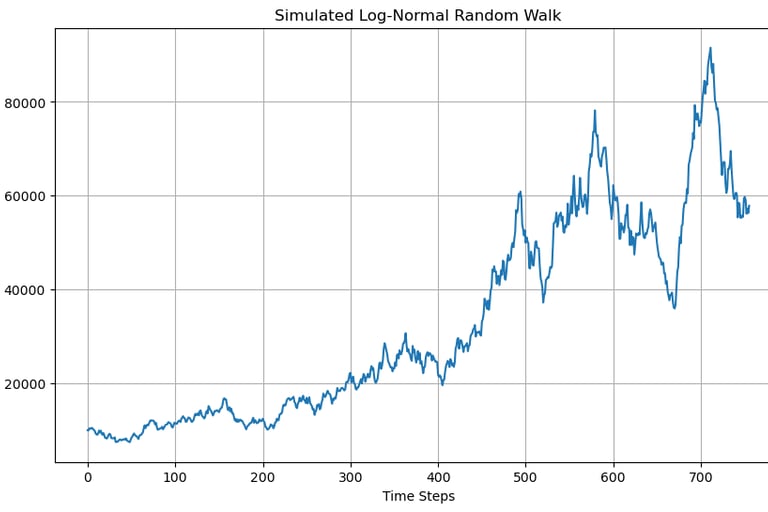
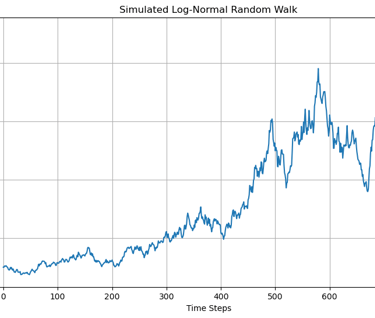
Mean of returns scale with time larger is the time step larger is the mean and Standard deviation of returns scale with square root of time. Thus change in price of stock can be written as Si - Si-1 = Si-1(µdt + 𝜎𝜙√dt). This equation represents a stochastic process that follows a log normal random walk. A realization of which is shown in below image. µ is the drift term which represents the expected rate of return of the asset over time. µ defines the direction in which price of the asset is headed to. 𝜎𝜙√dt represents the randomness involved with asset prices together mu and sigma define the overall behaviour of price of the asset. Stochastic modelling plays a very vital role in Quantitative finance as most financial instruments involve some degree of randomness and to make a informed decision it becomes imperative to model the randomness.